Some of us marketers have an unhealthy obsession with YouTube analytics — we track too many of them. Maybe we think we can prove any video marketing campaign is producing results if there’s an eye-catching percentage by its name. But, deep down, we all know that some metrics are more revealing than others.

There are a ton of KPIs we can look at that provide minimal insights. Fortunately, though, we created this guide to help you navigate YouTube Analytics and measure the metrics that actually matter. It’ll save you from drowning in the sea of analytics that most marketers only have a lifebuoy in, helping you not only stay afloat but swim safely to land.→ Free Templates: How to Use YouTube for Business [Download Now]
Read on to learn about the YouTube metrics that actually matter, and how they’ll enhance your video strategy.
YouTube Analytics: The 15 Metrics That Actually Matter
1. Watch Time
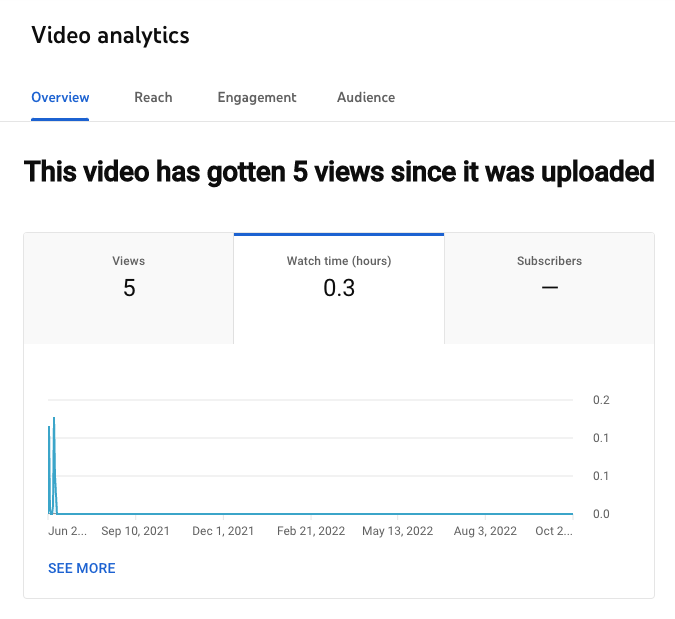
Watch time is the total amount of minutes viewers have spent watching your videos. It’s a key metric because YouTube elevates videos and channels with higher watch times in their search results and recommendations section. YouTube does this because the more watch time a video has, the more engaging their algorithm presumes it is.
In the Watch time report, you can see the amount of watch time your videos have accumulated. You can also rank each of your videos by watch time and group your videos by themes, styles, and lengths to determine your most engaging types of videos.
How to find Watch time in YouTube Studio:
Analytics > Overview > Watch Time
2. Average Percentage Viewed
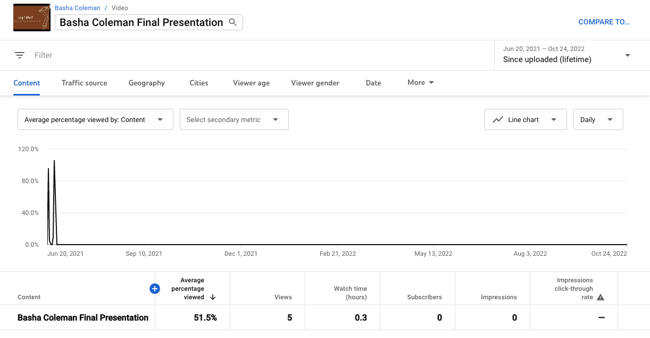
Average percentage viewed is the percent of each video the average viewer watched. It measures your video’s ability to hold viewers’ attention for its entirety. And when YouTube realizes your videos can hold people’s attention, they’ll reward it with higher search and recommendation rankings. You can find this metric in your watch time report.
How to find Average Percentage Viewed in YouTube Studio:
Analytics > Overview > Watch time > See More > Content > Watch time > More Metrics > Overview > Average percentage viewed
3. Average View Duration
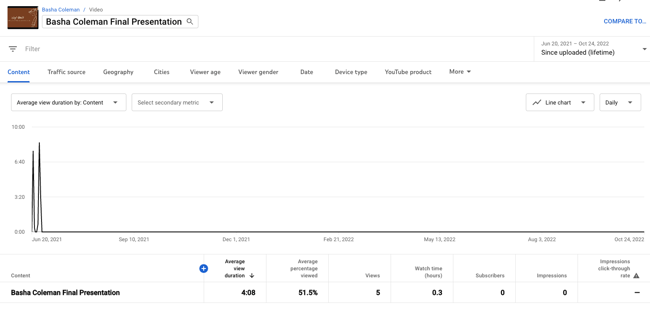
Average view duration is the total watch time of your video divided by the total number of video plays, including replays. This metric measures your video’s ability to engage viewers. If your video can’t engage viewers, they’ll bounce from your video quickly, leaving you with an unimpressive average view duration. But if your video can engage viewers, your average view duration and total watch time will increase at the same time, boosting your search and recommendations rankings. You can also find this metric in your watch time report.
How to find Average View Duration in YouTube Studio:
Analytics > See More > Watch time > More Metrics > Overview > Average view duration
4. Audience Retention
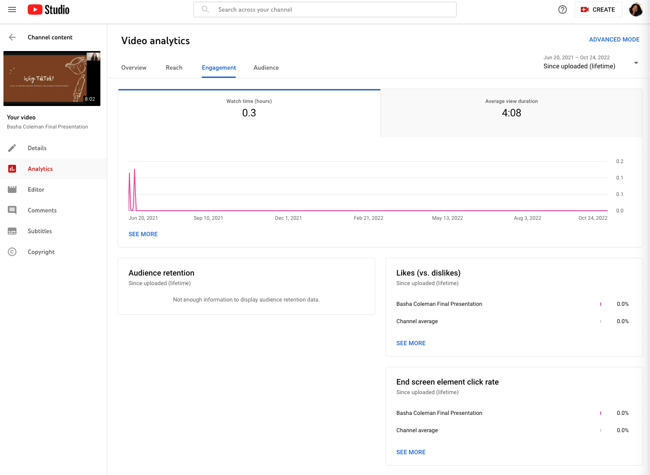
Audience retention shows you the percentage of viewers who watch and leave your video at every single moment of the video. YouTube elevates videos with high audience retention in their search rankings and suggestions because these videos can effectively capture viewers’ attention.
Audience retention can also inform your future video strategy. The most engaging parts of your video could be your next best video topics. And watching your video during steep dips of engagement will tell you what might be boring your viewers, allowing you to scrap those elements from current and future videos.
When you have enough data to generate YouTube’s audience retention report, there will be two graphs: the absolute retention curve and the relative retention curve. The absolute retention curve shows you how well your videos retain viewers. And the relative retention shows you how well one of your videos retains viewers compared to all other YouTube videos of similar length.

How to find Audience Retention in YouTube Studio:
Analytics > Engagement > Audience retention
5. Re-watches
Re-watches are the amount of times viewers re-watch certain parts of your video. If a lot of people are re-watching a specific part of your video, then they’re probably interested in the topic your video is covering during that moment. These topics can be fodder for your future video strategy. You can find this data in the absolute audience retention graph. Re-watches are usually indicated by rising curves in the graph.

How to find Rewatches in YouTube Studio:
Analytics > Engagement > Audience retention > Absolute audience retention
6. Engagement
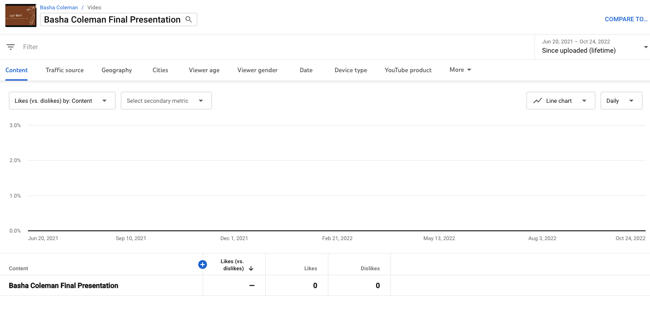
Comments, shares, likes, and dislikes provide marketers with a lot of valuable qualitative data.
Comments can paint a clear picture of your video’s emotional effect on viewers. Shares can gauge how much viewers value your content and brand — since people share content that confirms their ideal self-persona, people who share your video are publicly displaying that they trust and support your brand. Likes and dislikes can help you determine what video topics work best with your particular audience. You can find your videos’ engagement metrics in YouTube’s Interactions Report.
How to find Engagement in YouTube Studio:
Analytics > Engagement > Likes (vs. dislikes) > See More
7. Impressions Click-Through Rate
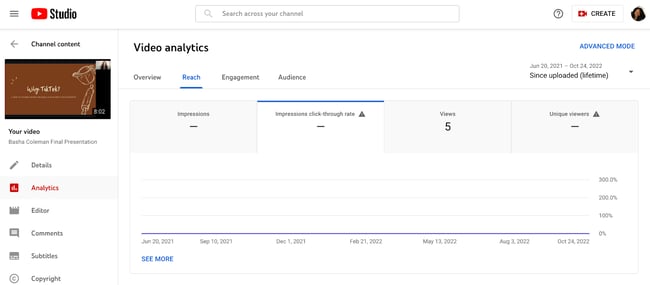
Impressions click-through rate measures your video’s ability to prompt people to watch your video after seeing it on their homepage, recommendation section, or trending section. A high click-through rate means your title was compelling and your video’s topic resonates with a lot of relevant audiences on YouTube.
A common trend for impression click-through rates is that they usually spike immediately after you release your video — your subscribers will see the video at the top of their home page and probably click on it. But once your video spreads beyond your core audience, your click-through rate will decline and then stay at a stable rate.
You can also couple this metric with average percentage viewed and average view duration to see if people actually watch your video after they click on it. A high click-through rate is great, but if people are leaving right at the beginning of your video, your title or thumbnail could be misleading. Preparing viewers for what’s to come is crucial because if your title or thumbnail is inaccurate, they’ll feel deceived and lose trust in your brand.
A low click-through rate but high engagement could mean that the video has a small yet specific audience that is enamored by the content.
How to find Engagement in YouTube Studio:
Analytics > Reach > Impressions click-through rate

8. Card Clicks
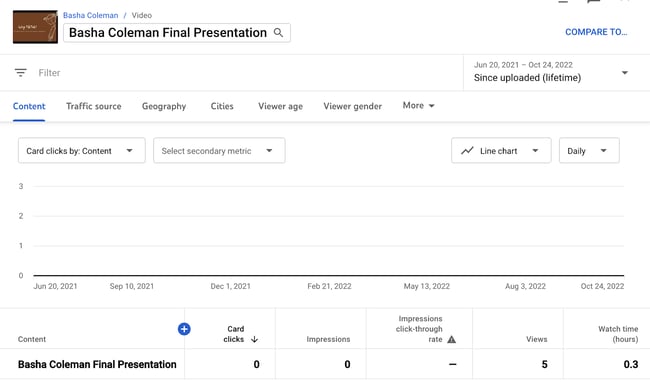
Cards are slide-in panels that encourage people to take a desired action during a video like watch another video, subscribe to a channel, or click through to a different website. Each of your cards’ click-through rate tells you which action your viewers prefer to take while watching your videos. This can help you place the most engaging card in each of your videos, potentially boosting your watch time, subscriber growth, or website traffic.
Analyzing card clicks can also help you uncover the optimal timing, placement, and duration of your cards in future videos.
How to find Card Clicks in YouTube Studio:
Analytics > Reach > See More > Impressions by: Content > More Metrics > Cards > Card Clicks

9. Playlist Engagement
Playlists are a great way to organize your videos in a digestible way. It helps your viewers easily consume videos about their favorite topics and prompts them to keep watching, which racks up watch time for your channel.
You can uncover your playlist engagement by analyzing two metrics in YouTube’s Playlist Report: views per playlist start and average time in playlist. Views per playlist start is the average number of video views your playlists gather, and average time in playlist is the average amount of time that viewers viewed the videos in your playlist. If these two metrics are underperforming, try starting your playlist with videos that have the highest retention rate.
How to find Playlist Engagement in YouTube Studio:
Analytics > Engagement > See More > Watch Time > More Metrics > Playlists
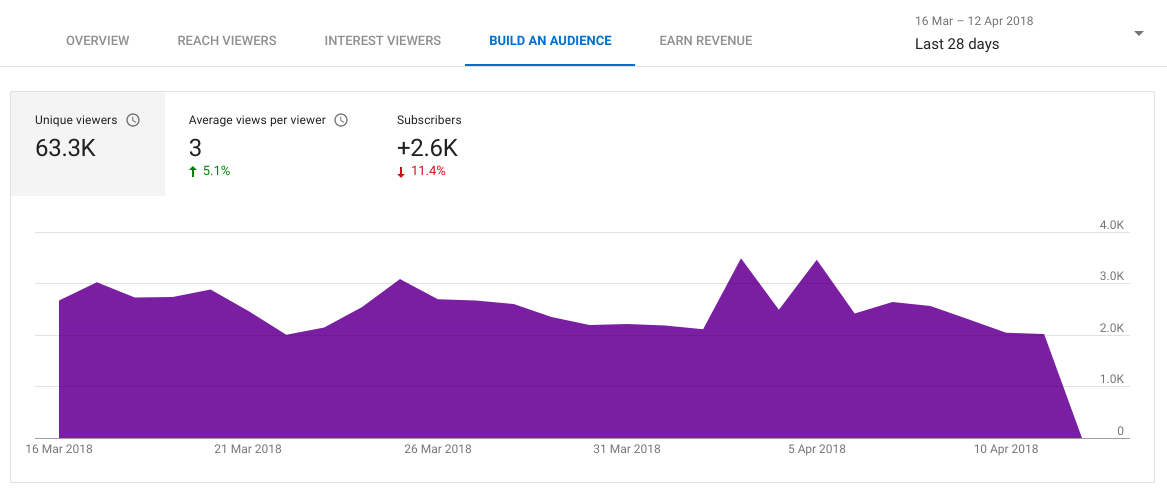
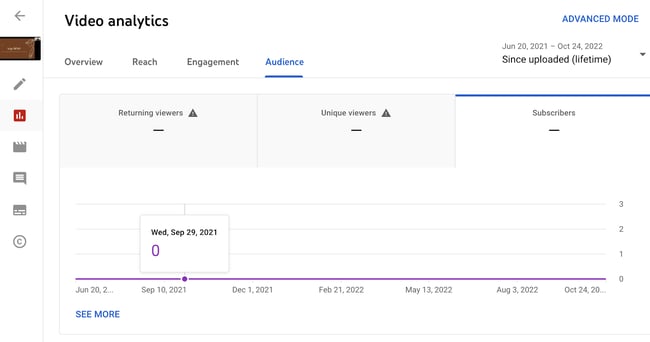
10. Unique Viewers
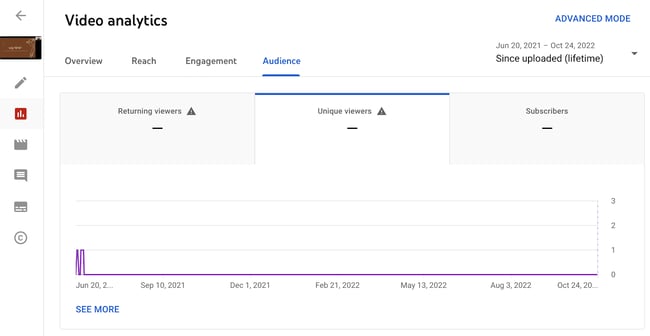
Unique viewers is the estimated number of individuals who watch your videos over a certain period of time. This metric really helps you understand the actual size of your audience.
You can also use this metric to gauge your subscriber’s engagement with your videos. If your unique viewers are lower than your subscriber count, then your subscribers aren’t watching as much of your video as they could be. To get them to be more active, ask them to set up notifications for your new videos. You can find this metric under the Reach Views and Audience tab in YouTube Studio.
How to find Playlist Unique Viewers in YouTube Studio:
Analytics > Audience > Unique viewers
11. Views Per Unique Viewers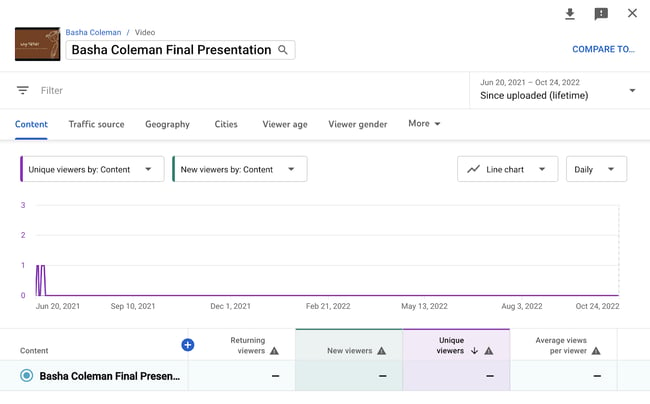
Views per unique viewers is the amount of times the average viewer watches your video. This metric tells you if people can’t get enough of your video and keep rewatching it. Video topics with a lot of views per unique viewers could also be your most popular content topics, and if you cover them more, you could generate more views, watch time, and subscribers.
How to find Playlist Unique Viewers in YouTube Studio:
Analytics > Audience > Unique viewers > See More > Average views per viewer
12. Who’s Watching Your Videos
In YouTube’s demographics report, you can see the different types of people who watch your videos, segmented by age, gender, and geography. This data tells you who your most engaged audience is and who your target audience should actually be. You can take the opposite approach with this data too. If you’re not reaching the audience you want, try pivoting your video strategy and cover topics that would attract them.
How to find Demographics in YouTube Studio:
Analytics > Audience > Age and Gender

13. Subscriber Growth

Subscribers are your most loyal fans. They’ve made a public commitment to your brand, content, and values. And they’re most likely to be your evangelists too. Subscribers are also important to your channel because YouTube will send them notifications about your new videos and feature them on their homepage. This means they’ll see your videos more frequently, which will help generate more views. Subscribers also watch twice as much video as non-subscribers, so the more subscribers you have, the more watch time your videos will collect.
YouTube’s Subscribers Report will show you which videos, locations, and time periods gain and lose subscribers. This data will tell you what video topics resonate with your subscribers and where to target new subscribers. And by prioritizing your subscribers’ needs, you’ll create videos that they crave, increase your watch time, and boost your search rankings.
How to find Subscribers in YouTube Studio:
Analytics > Audience > Subscribers
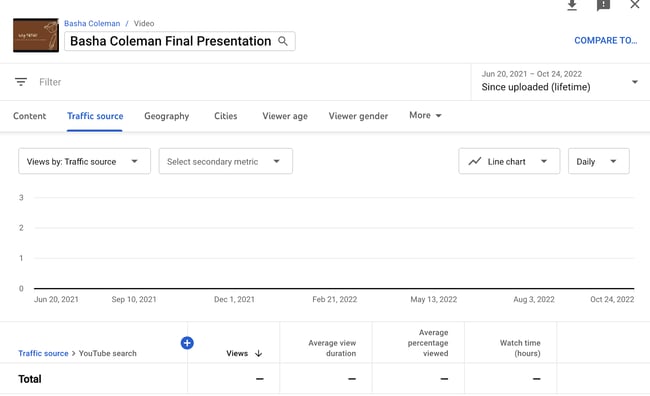
14. Traffic Sources
External referrals like social media or sites that embed your videos and YouTube referrals like search, the recommended section, and the homepage are all traffic sources. The Traffic Sources report shows you how viewers found your videos and what sources rack up the most views and watch time. You can use this data to better optimize your video promotion strategy.
How to find Traffic Sources in YouTube Studio:
Analytics > Audience > Subscribers > See More > Traffic Source

15. Keywords
In YouTube’s Reach Report, which is under the Traffic Sources Report, you can see the most popular queries guiding viewers to your videos. If these queries are slightly different from your video’s topic, consider updating your video to fill these content gaps and add the keywords to your metadata. If there’s a stark difference, consider making a new video about these popular queries.
